

ESPN — NFL Playoff Preview
NFL Playoffs

An editorial experience with rich interactivity and animated dataviz to preview the NFL Playoffs
01 — Overview
An epic postseason, elevated.
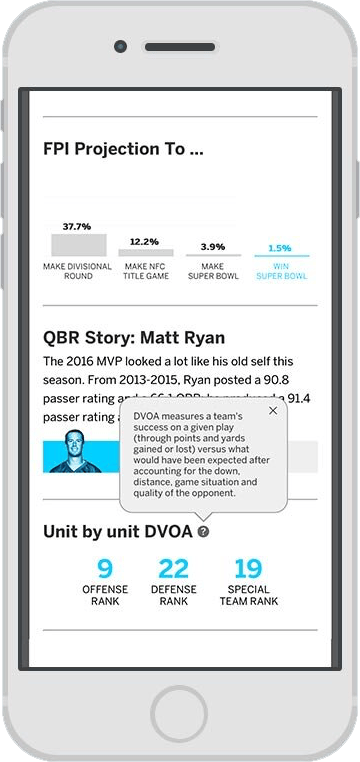
I created this premium feature for ESPN's 2017 NFL Playoffs coverage ↗. Story-first, data-driven, and designed with feeling.
02 — Role & Scope
Leading with craft & vision
After seeing success with similar experiences I created for NBA rivals and Fame 100 index, NFL Playoff Preview was a chance to take it to the next level with a high profile project. I started with the article by ESPN staff writer and fan favorite Bill Barnwell and pushed it to its limits with visuals, interactions, and usability. I served as project lead, art director, photo illustrator, designer, and front-end code (with some JavaScript help from a freelance developer to make sure interactions were really polished). This project took about 2 weeks, start to finish.
- Role
- Art Director, Designer, and project lead
- Scope
- Customized interactive and immersive content experience.
- Status
- Live with millions of pageviews.
03 — Approach
Fan-first thinking
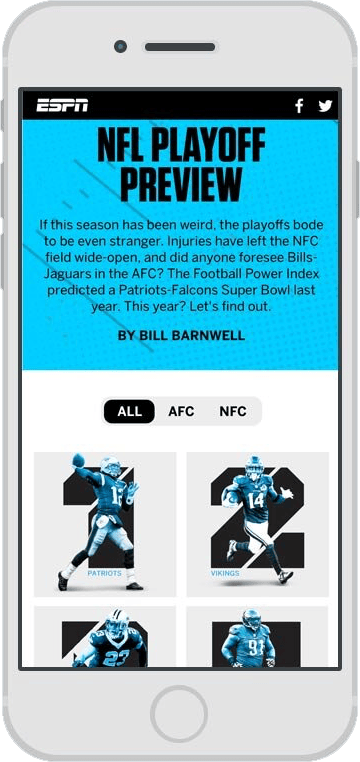
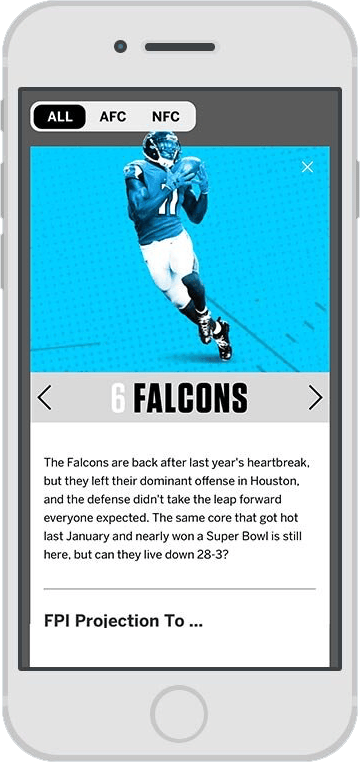
My goal for this project was to turn what could have been just a list into something deeper AND easier to use by thinking like a fan and creating a non-linear experience where users could jump to any team and compare their potential match-up with easy to understand animated infographics.
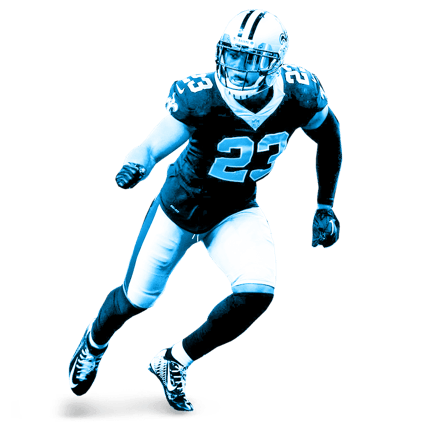
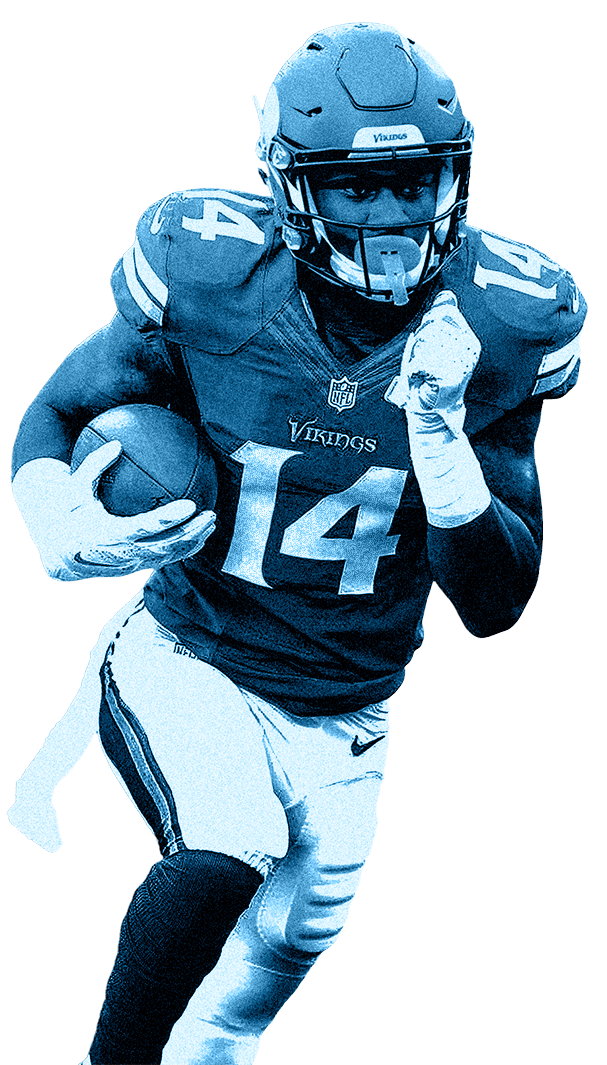
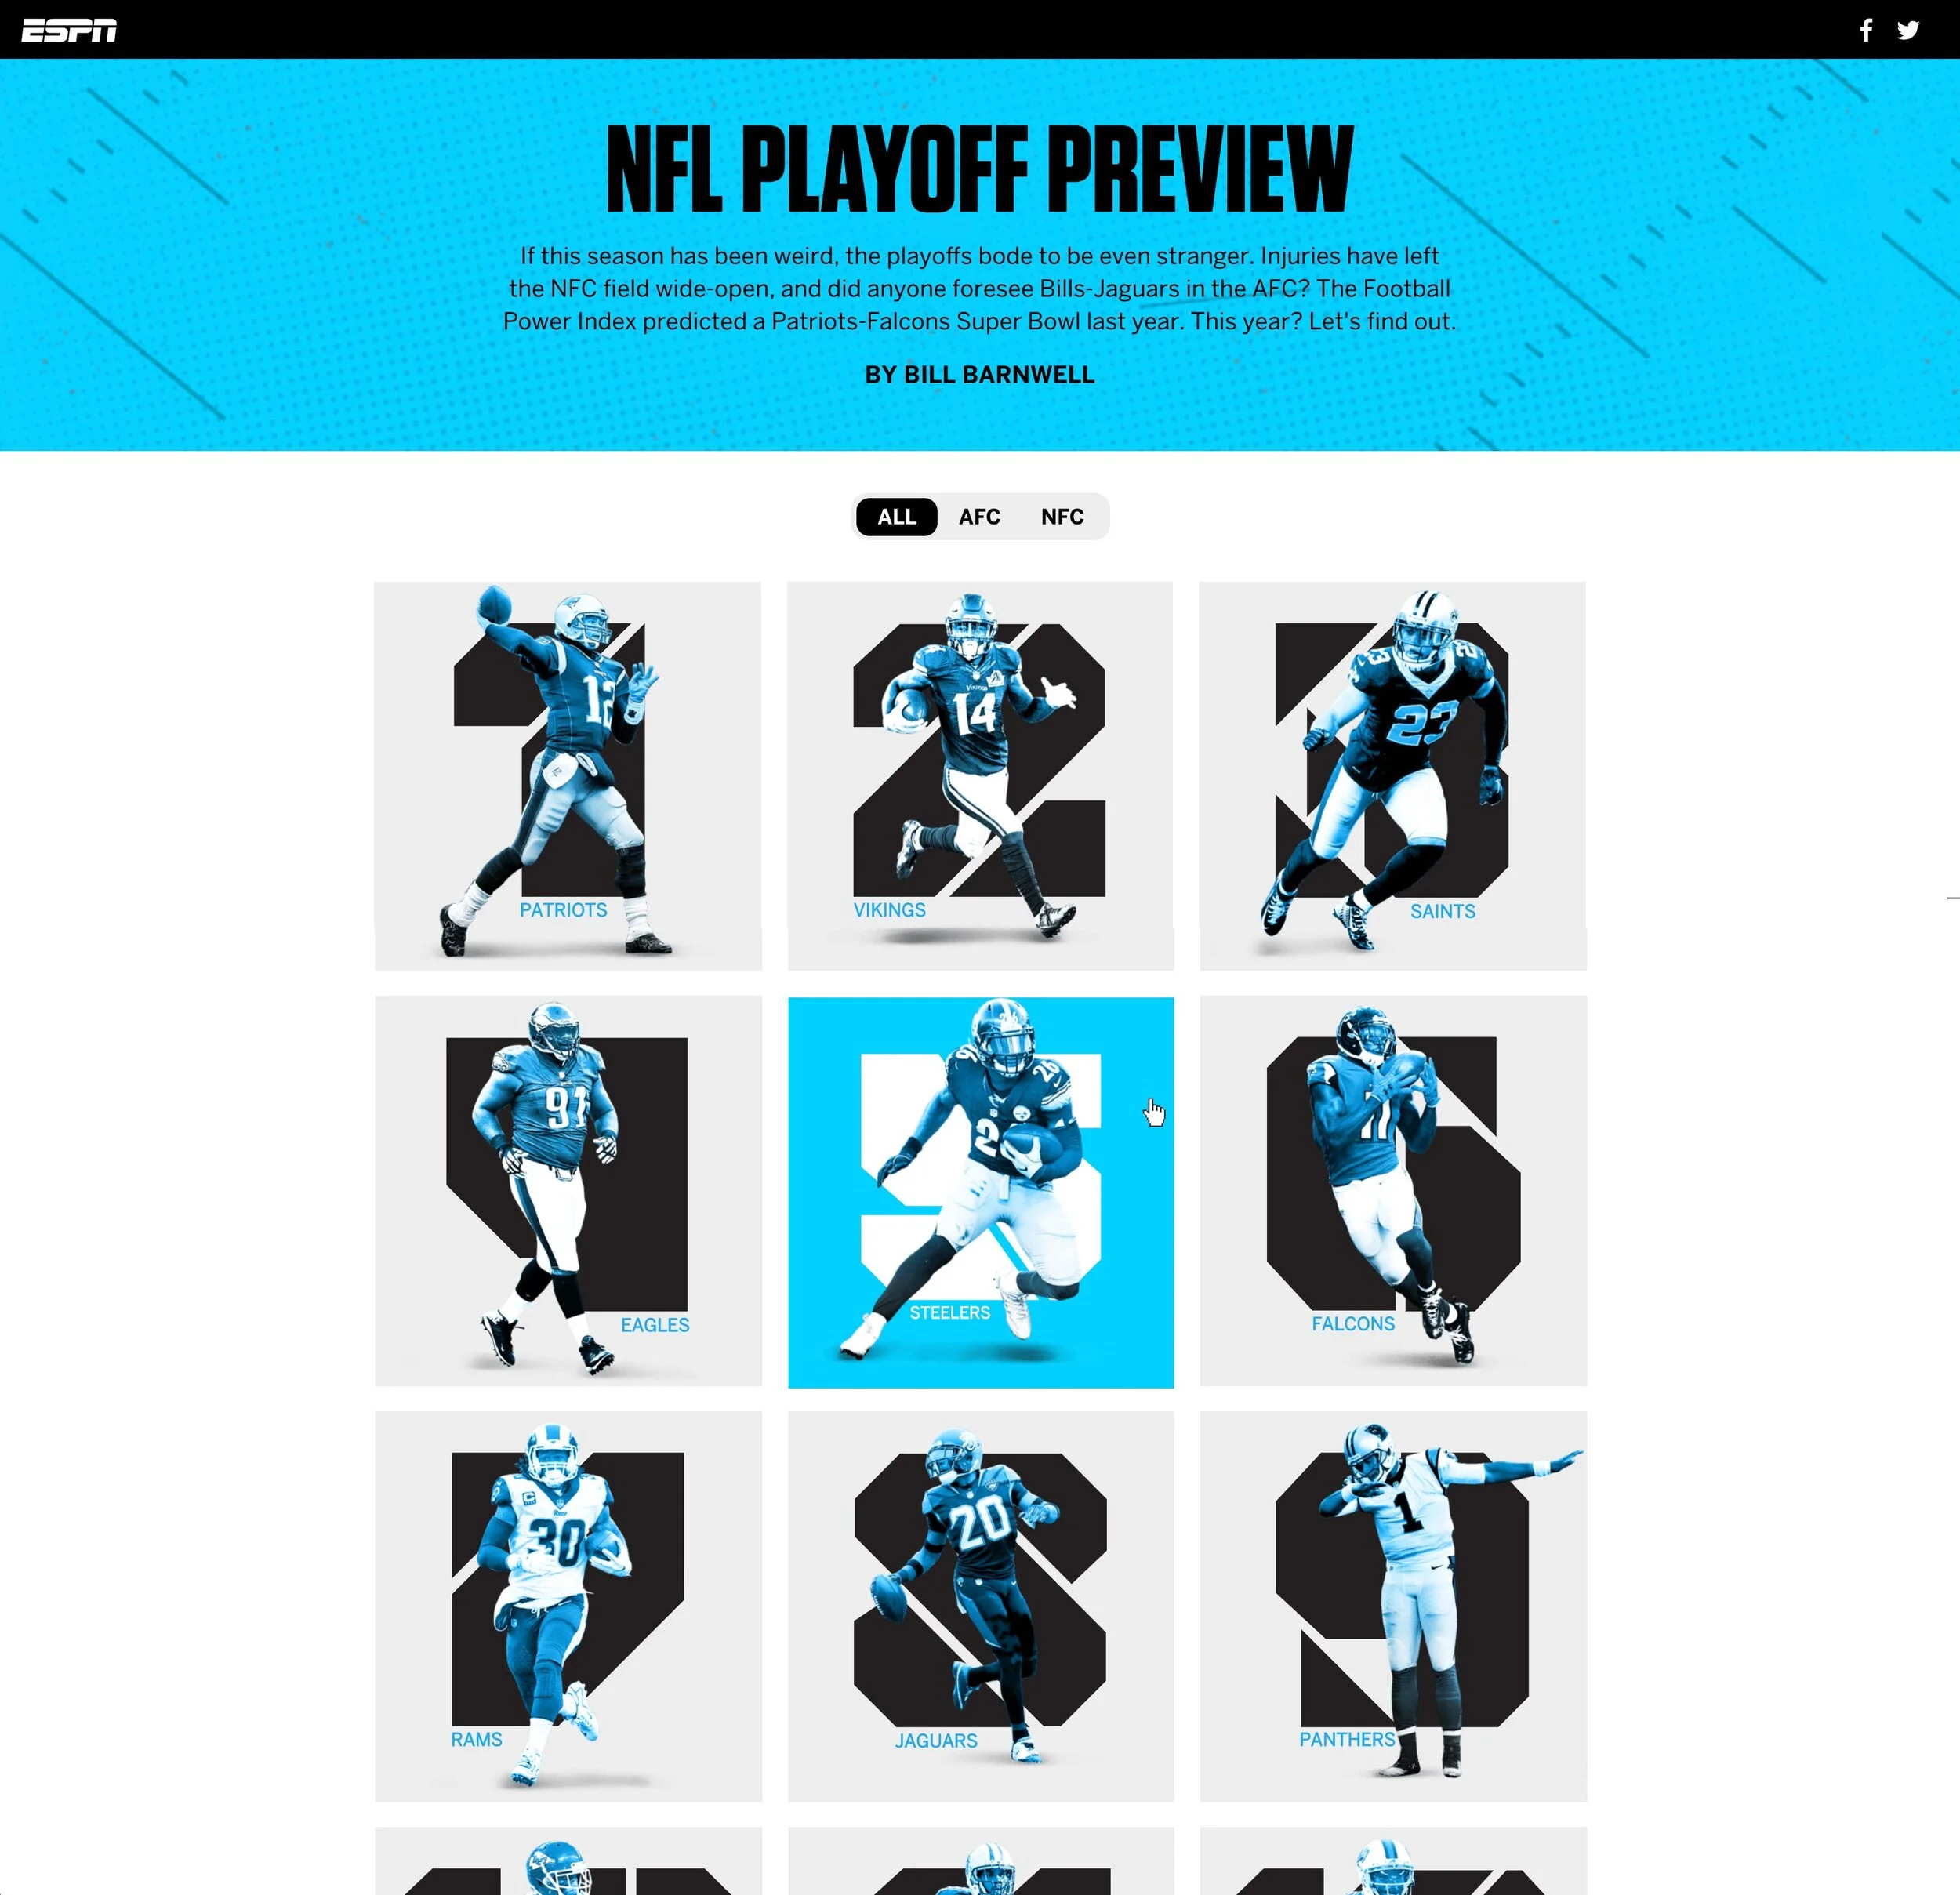
Beyond functionality, it needed to have personality. The photo treatment of high contrast, duo-tone silhouettes was chosen to unify stock images to make them feel custom. I created a reusable Photoshop action to process them quickly. I found the number font in an ESPN the Magazine archive and thought it would be perfect for this piece. And the animations and transitions were created to add a bit of 'wow' factor. I wanted them to feel punchy and impactful, and I dialed the easing curves and timing down to the millisecond.




Hover a card (or tap on touch) to preview the interaction.
04 — Dataviz
Numbers that tell a story
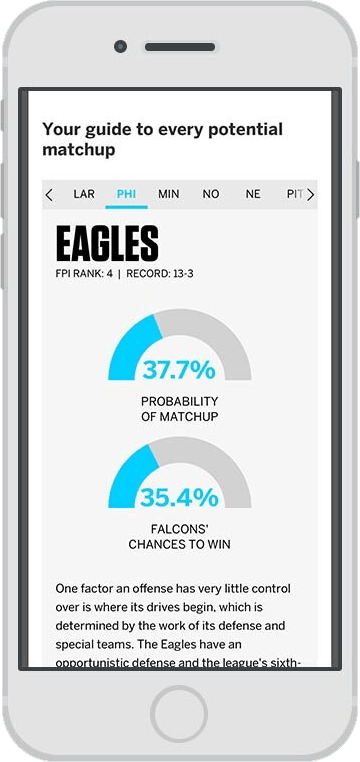
By giving each team its own page, I could contain the context of the data to 2 numbers as it relates to each team. Odds of a matchup to happen. And odds of that team to win each matchup. Paired with simple navigation and animations, the data became extremely legible and useful for casual fans and stat nerds alike.
05 — Outcomes
Leaving an impression
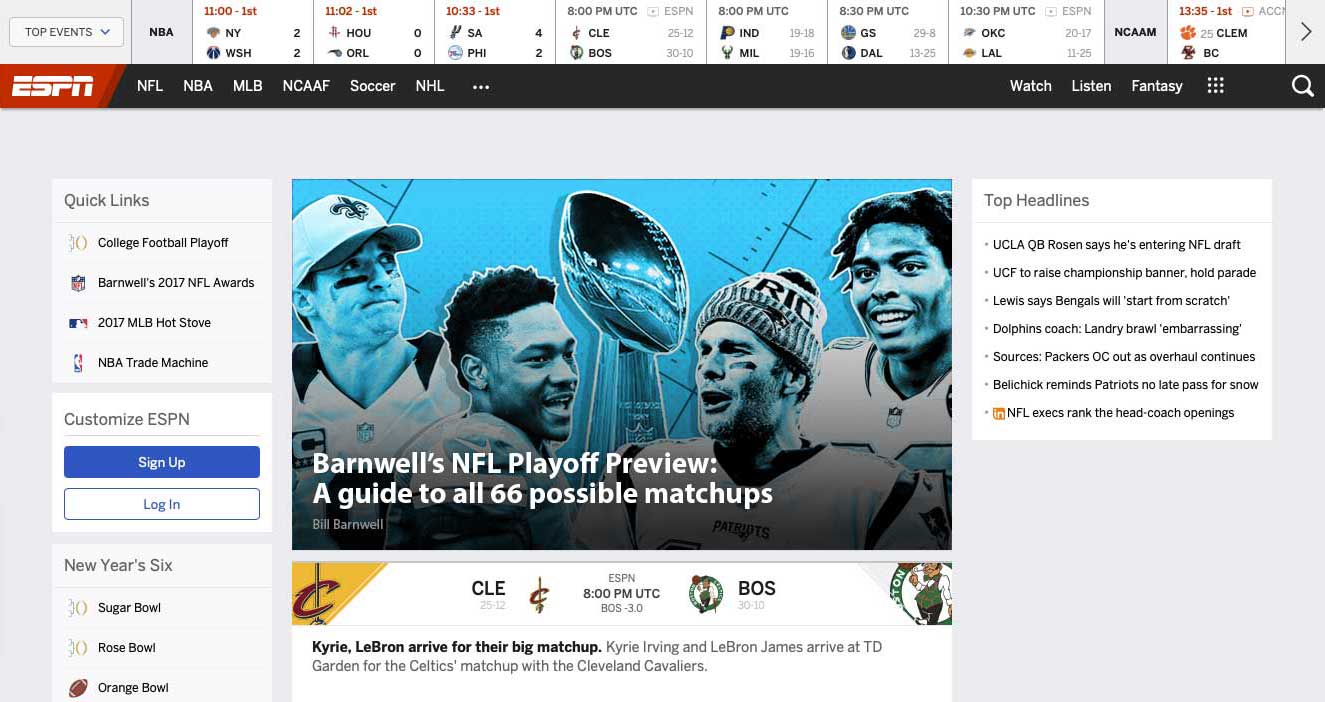
This piece was prominently showcased on the ESPN.com homepage, leading the homepage for several days, generating millions of pageviews and social media shares. This was also my last project before I left ESPN, so it was nice to go out with a bang, having raised the bar for editorial experiences, interactions, and data visualizations.
 Launch experience ↗